Mapping the knowledge-building of a global network
Advancing the humanitarian mission through evidence and learning
This was originally posted as a story on Prepare Center.
Why GDPC is mapping research
As a member of the Red Cross Red Crescent Research Consortium (RC3), the Global Disaster Preparedness Center (GDPC) developed a mapping of past and current research activities, studies, and academic papers supported by consortium members. The supported research activities, when considered as a whole, would rival the bodies of work of many universities, academic and research institutions.
The inspiration behind this mapping came from the observation that the Red Cross Red Crescent global network generates a wealth of knowledge on a variety of subjects but there was no comprehensive understanding of that expertise. The mapping helps leverage the expertise and provide a better view of the big picture.
The GDPC is deeply committed to expanding an evidence base and investing in new knowledge. They hope that sharing learning across our networks, both internal and in the wider humanitarian community, is a valuable contribution towards the goal to achieve a greater humanitarian impact based on an evidence-based culture and optimized resources.
Inspiration For Continued Sharing
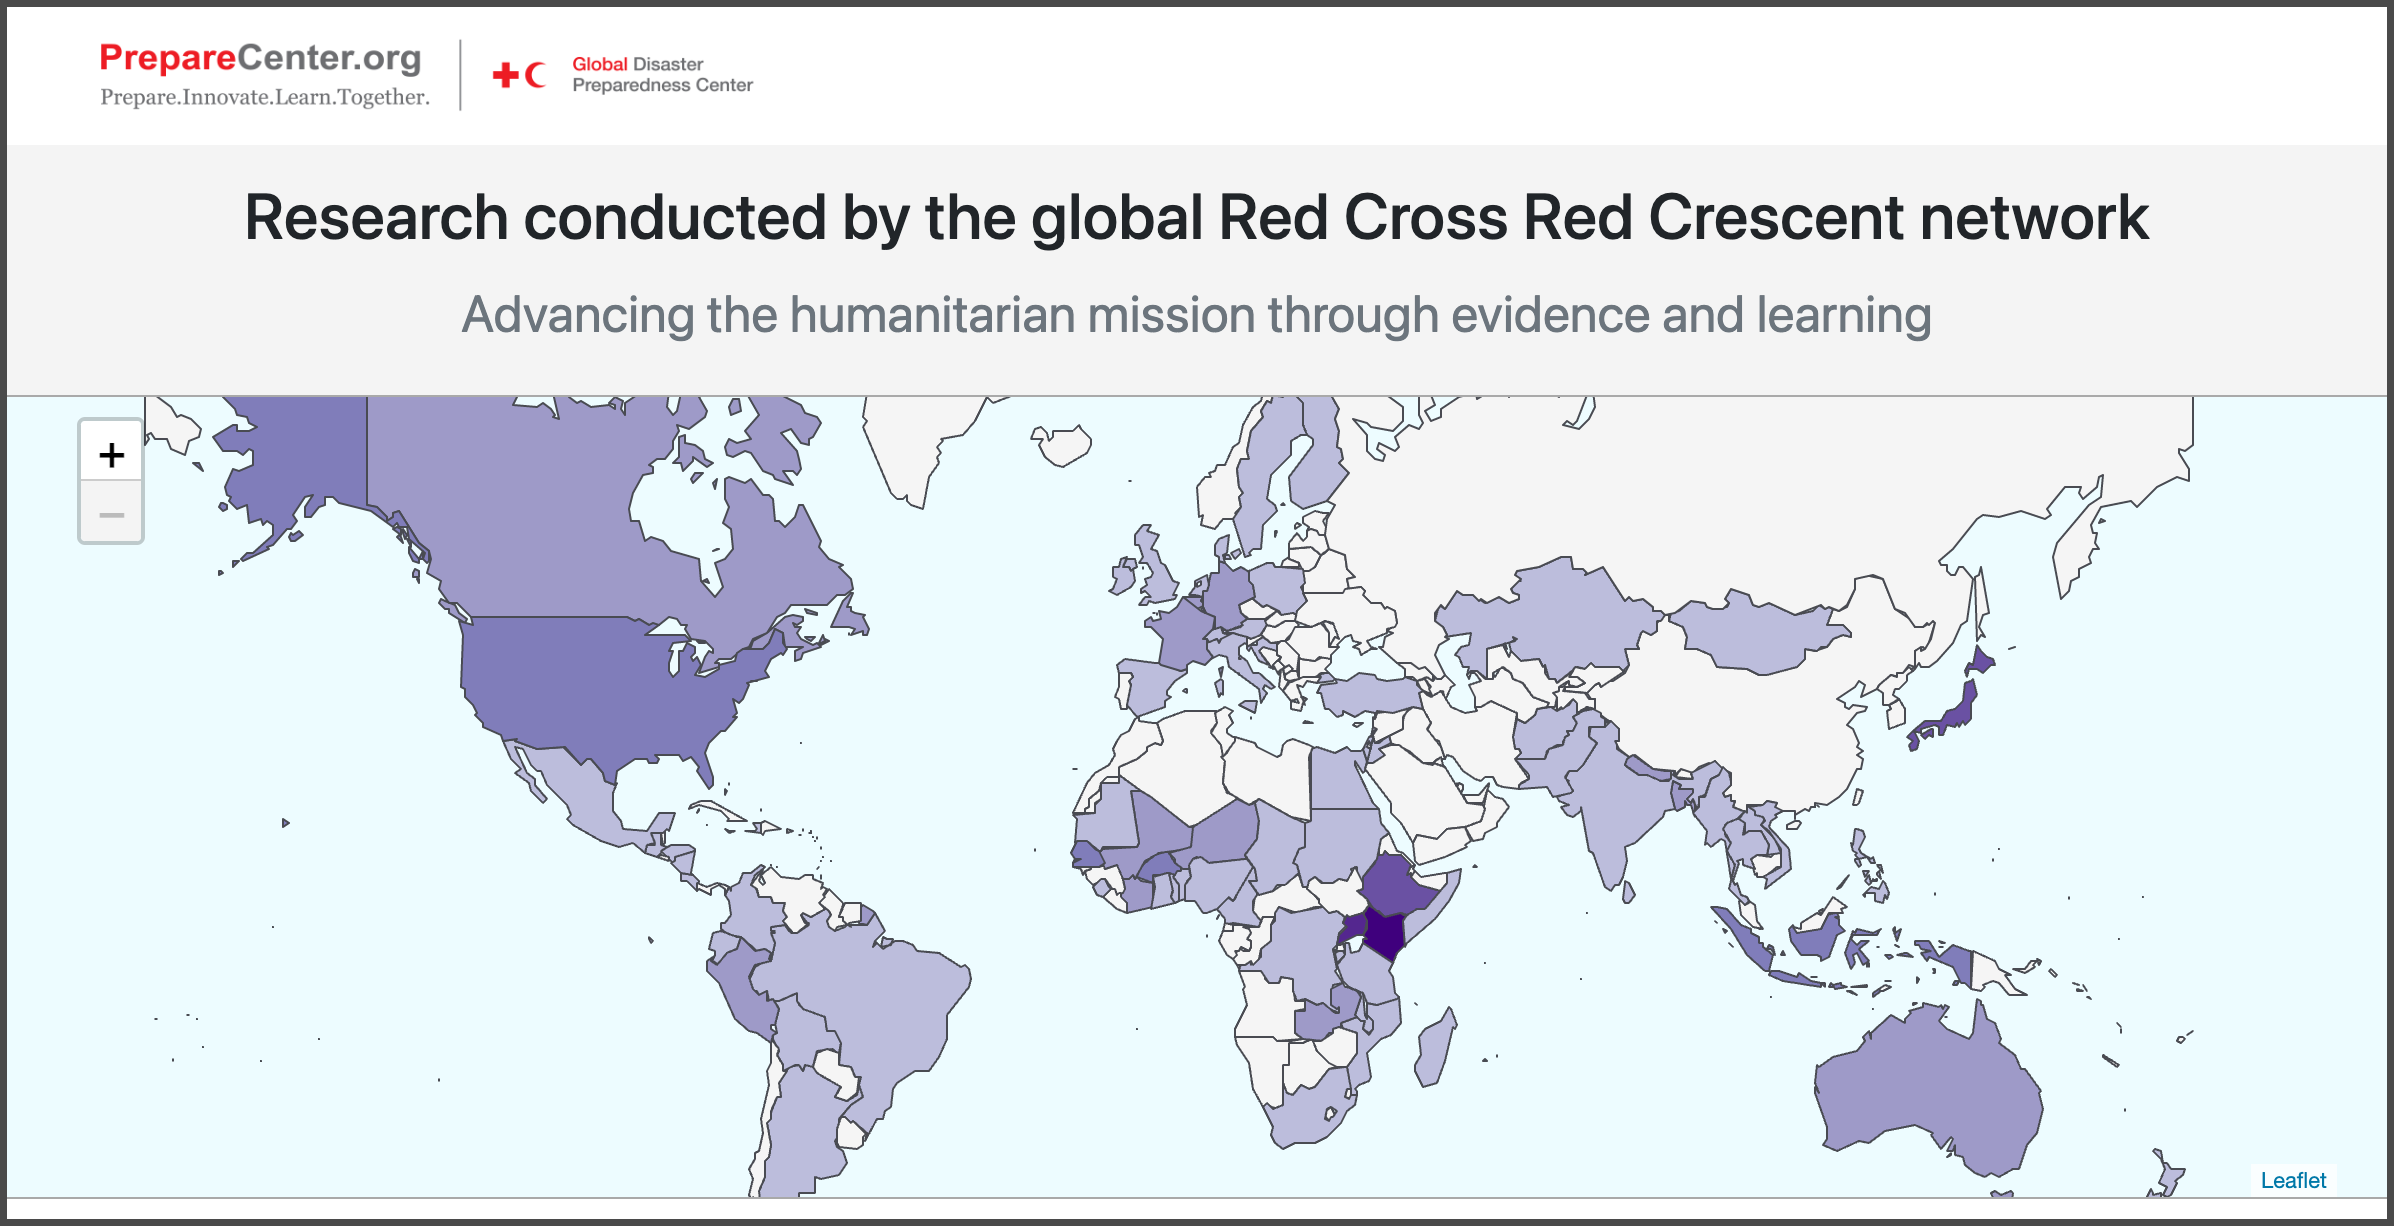
Since maps are a representation of the real world on a much smaller scale, they were able to broaden our understanding of the variety and distribution of our network’s research around the world. They asked partners and colleagues to share as much information as possible about a project including funding sources, type of research, research focus, lead organization, country or region of study, status, and language. Whenever possible links to the research findings were included. Nesrine Aouinti, Knowledge Management Fellow at the GDPC shares her insights:
During the mapping process, we were both inspired and heartened by the receptiveness of our colleagues. The map resonated with their individual efforts to work in synergy with other humanitarians. They find the map to be a practical and simple tool to quickly find connections between their own work and the work of others. This demonstrates once again that easily accessible and shared knowledge is a powerful asset for the humanitarian sector, now and into the future.
Visualizing the mapping
Open source building blocks for websites
To help the GDPC share their mapping, we needed a fast and inexpensive way to let people explore the data. Using open source tools we could quickly develop an interactive site and start gathering more feedback from users on what is useful for them. Github is a platform for software development that offers free hosting for basic website projects. Github Pages is a dependable and easy way to quickly get a website live. To build the website we used HTML/CSS and JavaScript and a number of open-source technologies: Bootstrap to help create the layout and style of our page; Leaflet to display the map, and dc.js to render the graphs (which utilizes Crossfilter and d3.js under the hood). The final step was to create a subdomain of the GDPC website so that our page is available at research.preparecenter.org instead of the default Github Pages URL of americanredcross.github.io/research-mapping.
Simple data storage and simple updates
A Google Spreadsheet can be a great place to collaborate on a dataset, and it used to be possible to pull data directly from Google Sheets into your webpage for visualizations using a nifty tool called Tabletop.js. Unfortunately, Google discontinued the infrastructure that made that possible but we did find a workaround of running a script to download the data and save it somewhere that is accessible to the wider web. With this hack we can continue using a Google Spreadsheet for the data behind the research mapping website, we just connect to a copy of the data stored on Github that is updated every 24 hours. This process makes it easy to update the research map data; if someone can edit a Google Sheet they can add and update the research entries on the website - no code required!
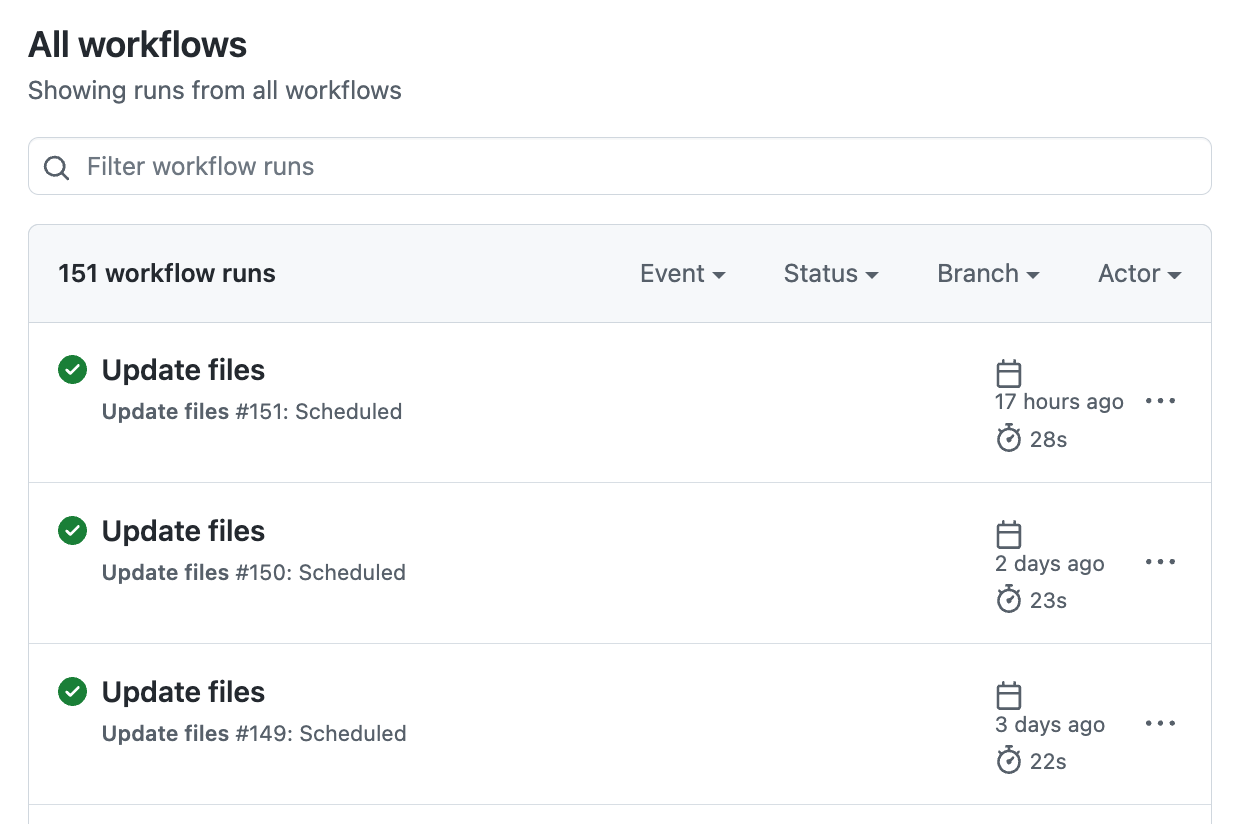
An automated build process pulls in any updates from the Google Sheet to the website every 24 hours.