Fire sensor project
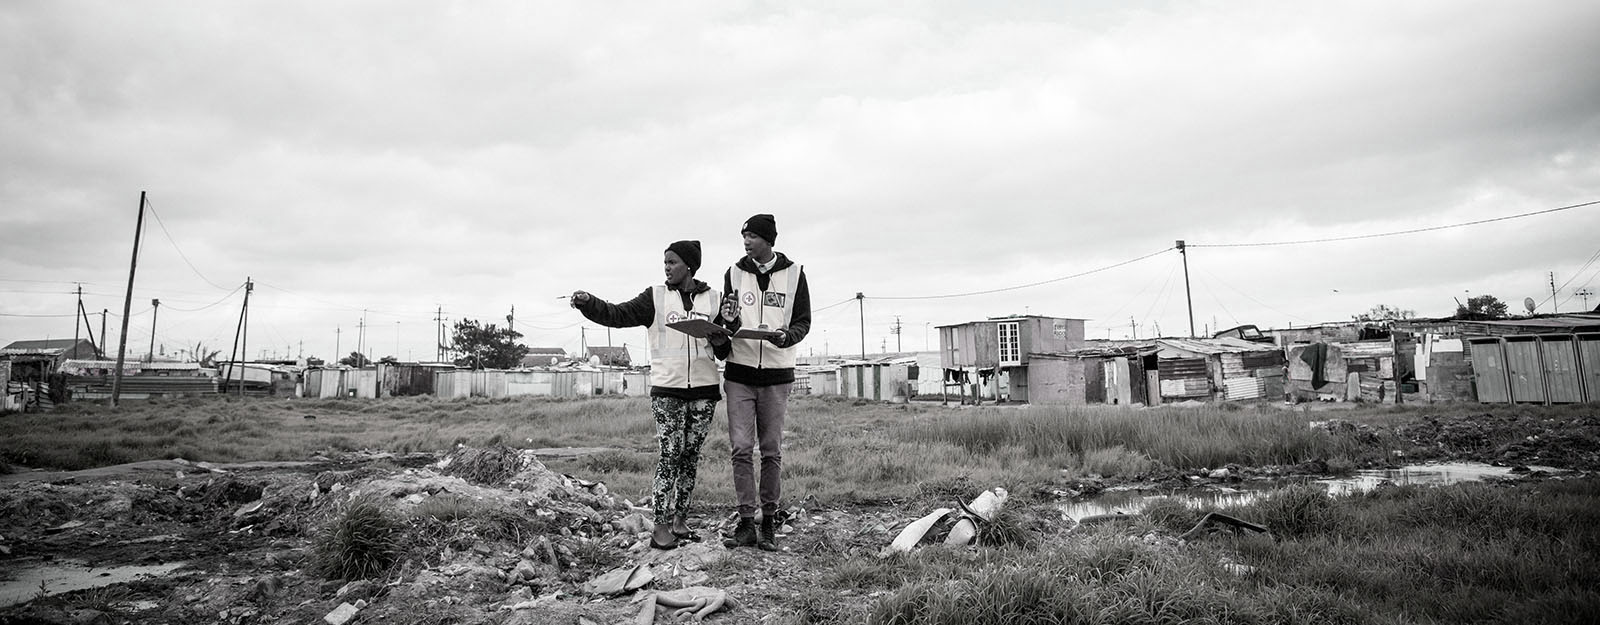
Two volunteers with South African Red Cross survey their community
Project background
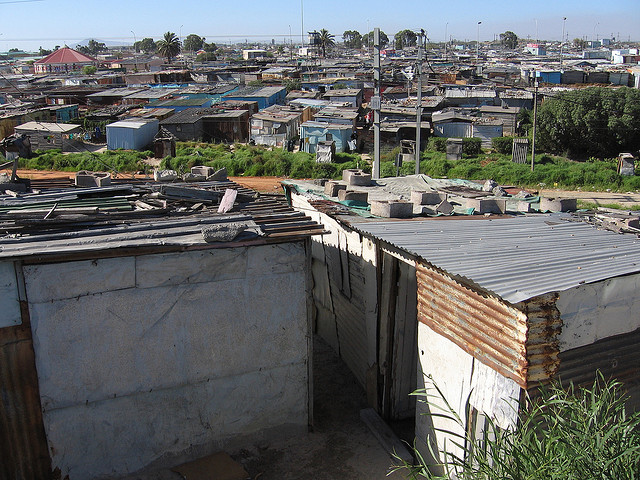
Nicely conditioned roads, beautiful beaches, cliffs, scenic bays, promenades, and hillside communities is what you think of when you hear Cape Town. However, a couple kilometers away from these spectacular sceneries and coastlines is Khayelitsha, a partially informal township reputed to be the largest and fastest growing township in South Africa. It’s a humbling sight to see.
Khayelitsha, CC-BY-SA elyob
If you get the chance to spend some time there you will see the amazing community spirit and warmth in the area despite its well known reputation for being extremely dangerous.
Khayelitsha is home to roughly 400,000 people, covering an area of 39 square km that includes some older “formal” areas and a majority of newer, informal settlements. Red Cross partners have been working in the area and looked into the major concerns the community is facing. Fires are at the top of the list. Fires regularly occur as a result of indoor stove use, trash burning, faulty wires, and residents trying to keep warm. Rapid, unplanned development results in homes that are very close together, which increases the chance of fires spreading quickly. Pathways between homes are narrow and often blocked, making evacuations chaotic and dangerous. Residents often do not know who to call for firefighting assistance, and if firefighters are available they have a difficult time finding the locations and responding to calls.
Red Cross partners are piloting a project to solve this issue: a low-cost, meshed network of smart home sensors affixed to each home within the informal settlement. The American Red Cross GIS team recently set out to Khayelitsha to support the community in mapping the area for better program planning and decision making. Here’s our story about the experience.
On the ground in Cape Town
Just a few days before the mapping was to start we were advised not to use smart phones due to new security concerns. We normally use phones to run the OpenMapKit mobile data collection app. Fortunately, we could use GPS devices as they would be much less desirable targets for theft.
Early on a very chilly morning we headed to the Andile Msizi Community Center in Khayelitsha with the South African Red Cross team. We met 34 volunteers and started a two-day training to introduce the volunteers to OpenStreetMap and the community mapping process. Volunteers were from the local area and immediately got hooked on the OSM iD editor looking at the satellite imagery of their neighborhoods and pointing out where they live.
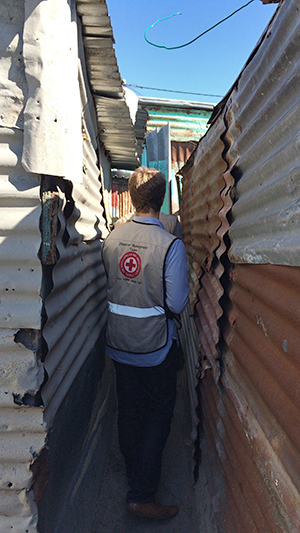
Navigating the narrow paths between houses, CC-BY American Red Cross
At the Community Center the group had insightful discussions, learned how to use printed Field Papers pages for collecting data, and practiced using the GPS devices. Breaks for hot coffee and pastries kept energy levels high.
Field mapping
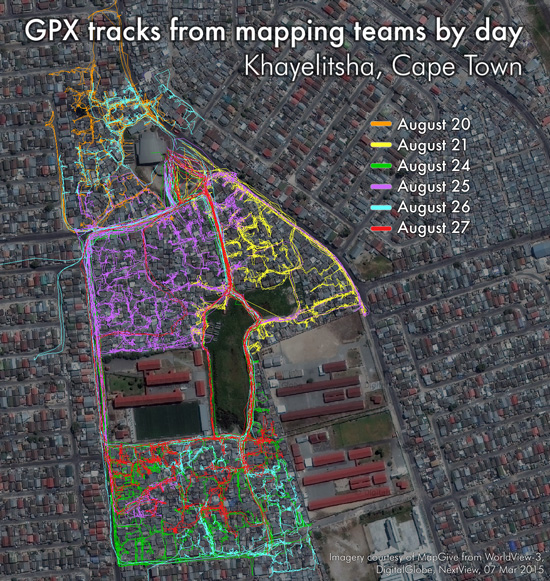
Our cozy days indoors ended as we headed out to start collecting data. Teams of 4-5 volunteers were escorted by community leaders and Red Cross staff into the section chosen for the day. We equipped our volunteers with Field Papers and Garmin GPS units to collect data and GPX tracks. The area is very dense and has no centralized plan or regular layout, and structures are generally small and non-rectangular.
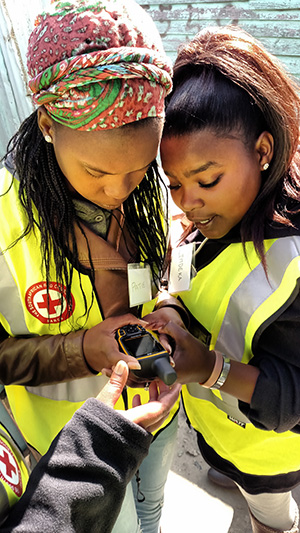
Volunteers verifying their position, CC-BY American Red Cross
Remote tracing was completed ahead of time by digital humanitarians and was hugely beneficial, giving us a fairly accurate foundation of data. The tracing was possible thanks to recent, high-resolution imagery from Mapgive. Map literacy can be a challenge for volunteers, and the better base map made the community mapping an easier process. The GPS devices were loaded with the Field Papers’ grid and the OpenStreetMap base map to help with navigation.
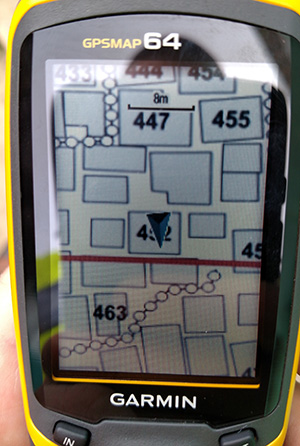
Garmin loaded with custom OSM data, CC-BY American Red Cross
After some initial fieldwork, we were able to use the GPX tracks from teams walking through the area to check the alignment of our two sources of satellite imagery (Bing and the very recently captured NextView imagery obtained through MapGive). It showed the MapGive imagery to be more accurately geo-referenced so we decided to adjust the OSM data to match the GPX tracks and MapGive imagery. Volunteers had time to re-visit some areas after the alignment of OSM data, but since the map tiles would not refresh quickly enough for new Field Papers, we created custom atlas pages with downloaded OSM data styled in QGIS. This worked out great to fill in gaps after the first round of mapping on the ground.
Field data collection focused on: editing outlines of buildings (combining, dividing, adding, and removing); adding the path network; adding amenities such as places of worship, shops, and taverns; adding features that were impossible to trace from satellite imagery such as electricity transformers, narrow rows of latrines, and water taps; and adding building numbers.
Building address numbers were a challenge to collect. Volunteers had to walk along two or more paths before being able to approach the part of the building with an entrance and see if a number was posted. Numbers were not always visible on the building, and in some areas the government had spray painted numbers on houses in the process of counting them, contradicting the actual house numbers.
We wrapped up the field mapping and then spent two days at the Community Center inputing data into OSM using JOSM editor.
Next steps
The American Red Cross GIS team will create large maps of the different sections to print and share with the communities. The volunteers will continue gathering data, collecting the locations of the fire sensors to then overlay OSM data to analyze the coverage of the project. We will also share knowledge of our work in OSM with other NGOs operating in the area.