OpenStreetMap Damage Assessment Review
Typhoon Haiyan (Yolanda) Interim Report
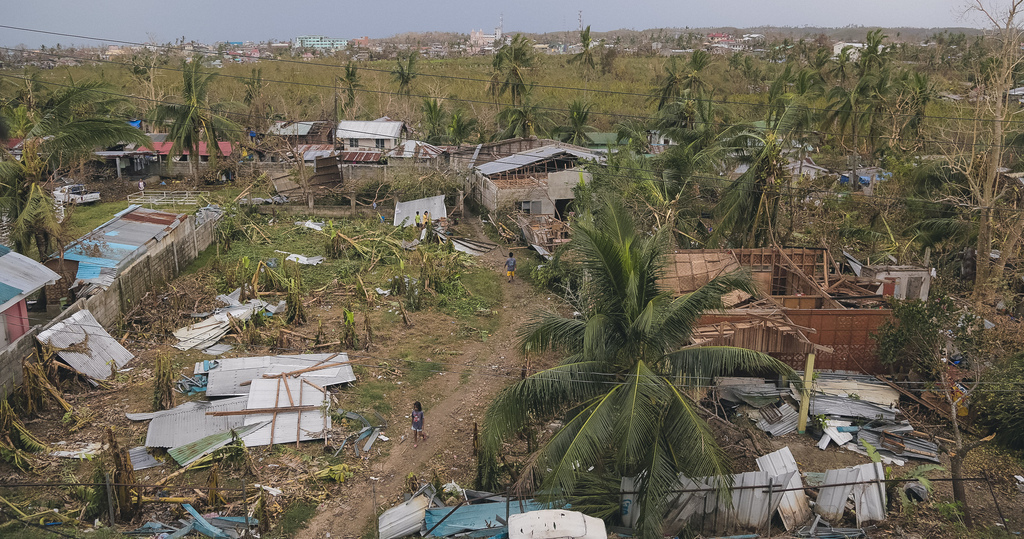 Typhoon Haiyan partially or totally destroyed roughly 1 million homes. Photo Credit: IFRC
The response to Typhoon Haiyan was a watershed moment for humanitarian uses of OpenStreetMap and crowdsourcing in general. The numbers speak for themselves: over 1,700 volunteers contributing 4.5 million edits, or roughly 3 to 4 years worth of mapping from a highly productive OpenStreetMap editor. The American Red Cross helped coordinate this response, directing volunteers to trace priority areas, based on information from the US Government and feedback from Red Cross responders in the field. The result was a rich base map of the Visayas region and a growing database of building damages contributed by volunteers eager to provide operationally useful data.
Intrigued by the possibilities of open data for powering disaster response and recovery, the US Agency for International Development’s Office of Foreign Disaster Assistance approached the American Red Cross during the early days of the disaster to commission a rapid survey of the accuracy of the building damage classifications being collected within OSM. A partnership was proposed and quickly formed with the REACH Initiative, whose proven experience administering surveys and applying GIS in complex disaster scenarios complemented well the American Red Cross’s depth of knowledge in OpenStreetMap. Both organizations operated under the overall banner of the Global Shelter Cluster, which provided critical legitimacy, organzational support and feedback throughout the project. By November 27, 19 days after Typhoon Haiyan (Yolanda) made landfall, the survey team was in Tacloban preparing the methodology. The interim report below describes the process of administering this assessment, our key findings and their implications for future disasters.
Executive Summary
This report measures the accuracy of building damage assessments conducted by the OpenStreetMap community in select areas affected by Typhoon Haiyan (Yolanda). In Haiti, the Philippines and countless smaller disasters over the past three years, OpenStreetMap and the Humanitarian OpenStreetMap Team have proven their ability to rapidly create high-quality geographic base data such as streets, houses, farms and other observable phenomena. The intent of this assessment was to assess the ability of crowdsourced platforms to go beyond this base data and quickly, remotely create information about building-level damages in areas affected by natural disasters. Its secondary goal was to explore the possibility of linking standard post-disaster shelter surveys with data created by OSM contributors. The overall goal was to define the appropriate shape, form and extent of crowdsourced inputs to existing disaster assessment tools.
Map 1: This map shows a view of Tacloban, Philippines before (left) and after (right) the Typhoon.
This report identifies areas of strong promise and distinct limitations for crowdsourcing damage assessments through OSM. It discusses the initial findings and delivers recommendations on investments in technology, policy and programmatic approaches that could overcome existing limitations and improve the accuracy and impact of using OSM as a viable damage assessment method.
Overall the assessment shows that the OSM damage assessment data created in the area affected by Typhoon Haiyan (Yolanda) is not reliable enough to utilize for damage analysis and recovery planning. On the ground, existing tools for linking assessments with OSM data are too unreliable and manual to be practical in a large-scale disaster. However, the data was not so invalid, nor the technology so obtuse, as to suggest a lack of promise in these approaches. The assessment found that modest investments in technology, business processes and pre-disaster activities could make OSM a strong platform for damage assessment data and analysis in future disasters.
This assessment was conducted through a partnership between the REACH Initiative and the American Red Cross with funding from the U.S. Office of Foreign Disaster Assistance (OFDA). Data collection and analysis ran in parallel to the REACH facilitated Global Shelter Cluster needs assessment in order to share resources and have sources of comparison and triangulation of data.
Methodology in Brief
To test the validity of remotely created damage data, small teams of paid enumerators assessed building damages in randomly selected areas in six municipalities highly affected by the typhoon. Five of these areas were assessed by OSM contributors after Typhoon Haiyan's passage using satellite imagery from the State Department’s Humanitarian Information Unit.
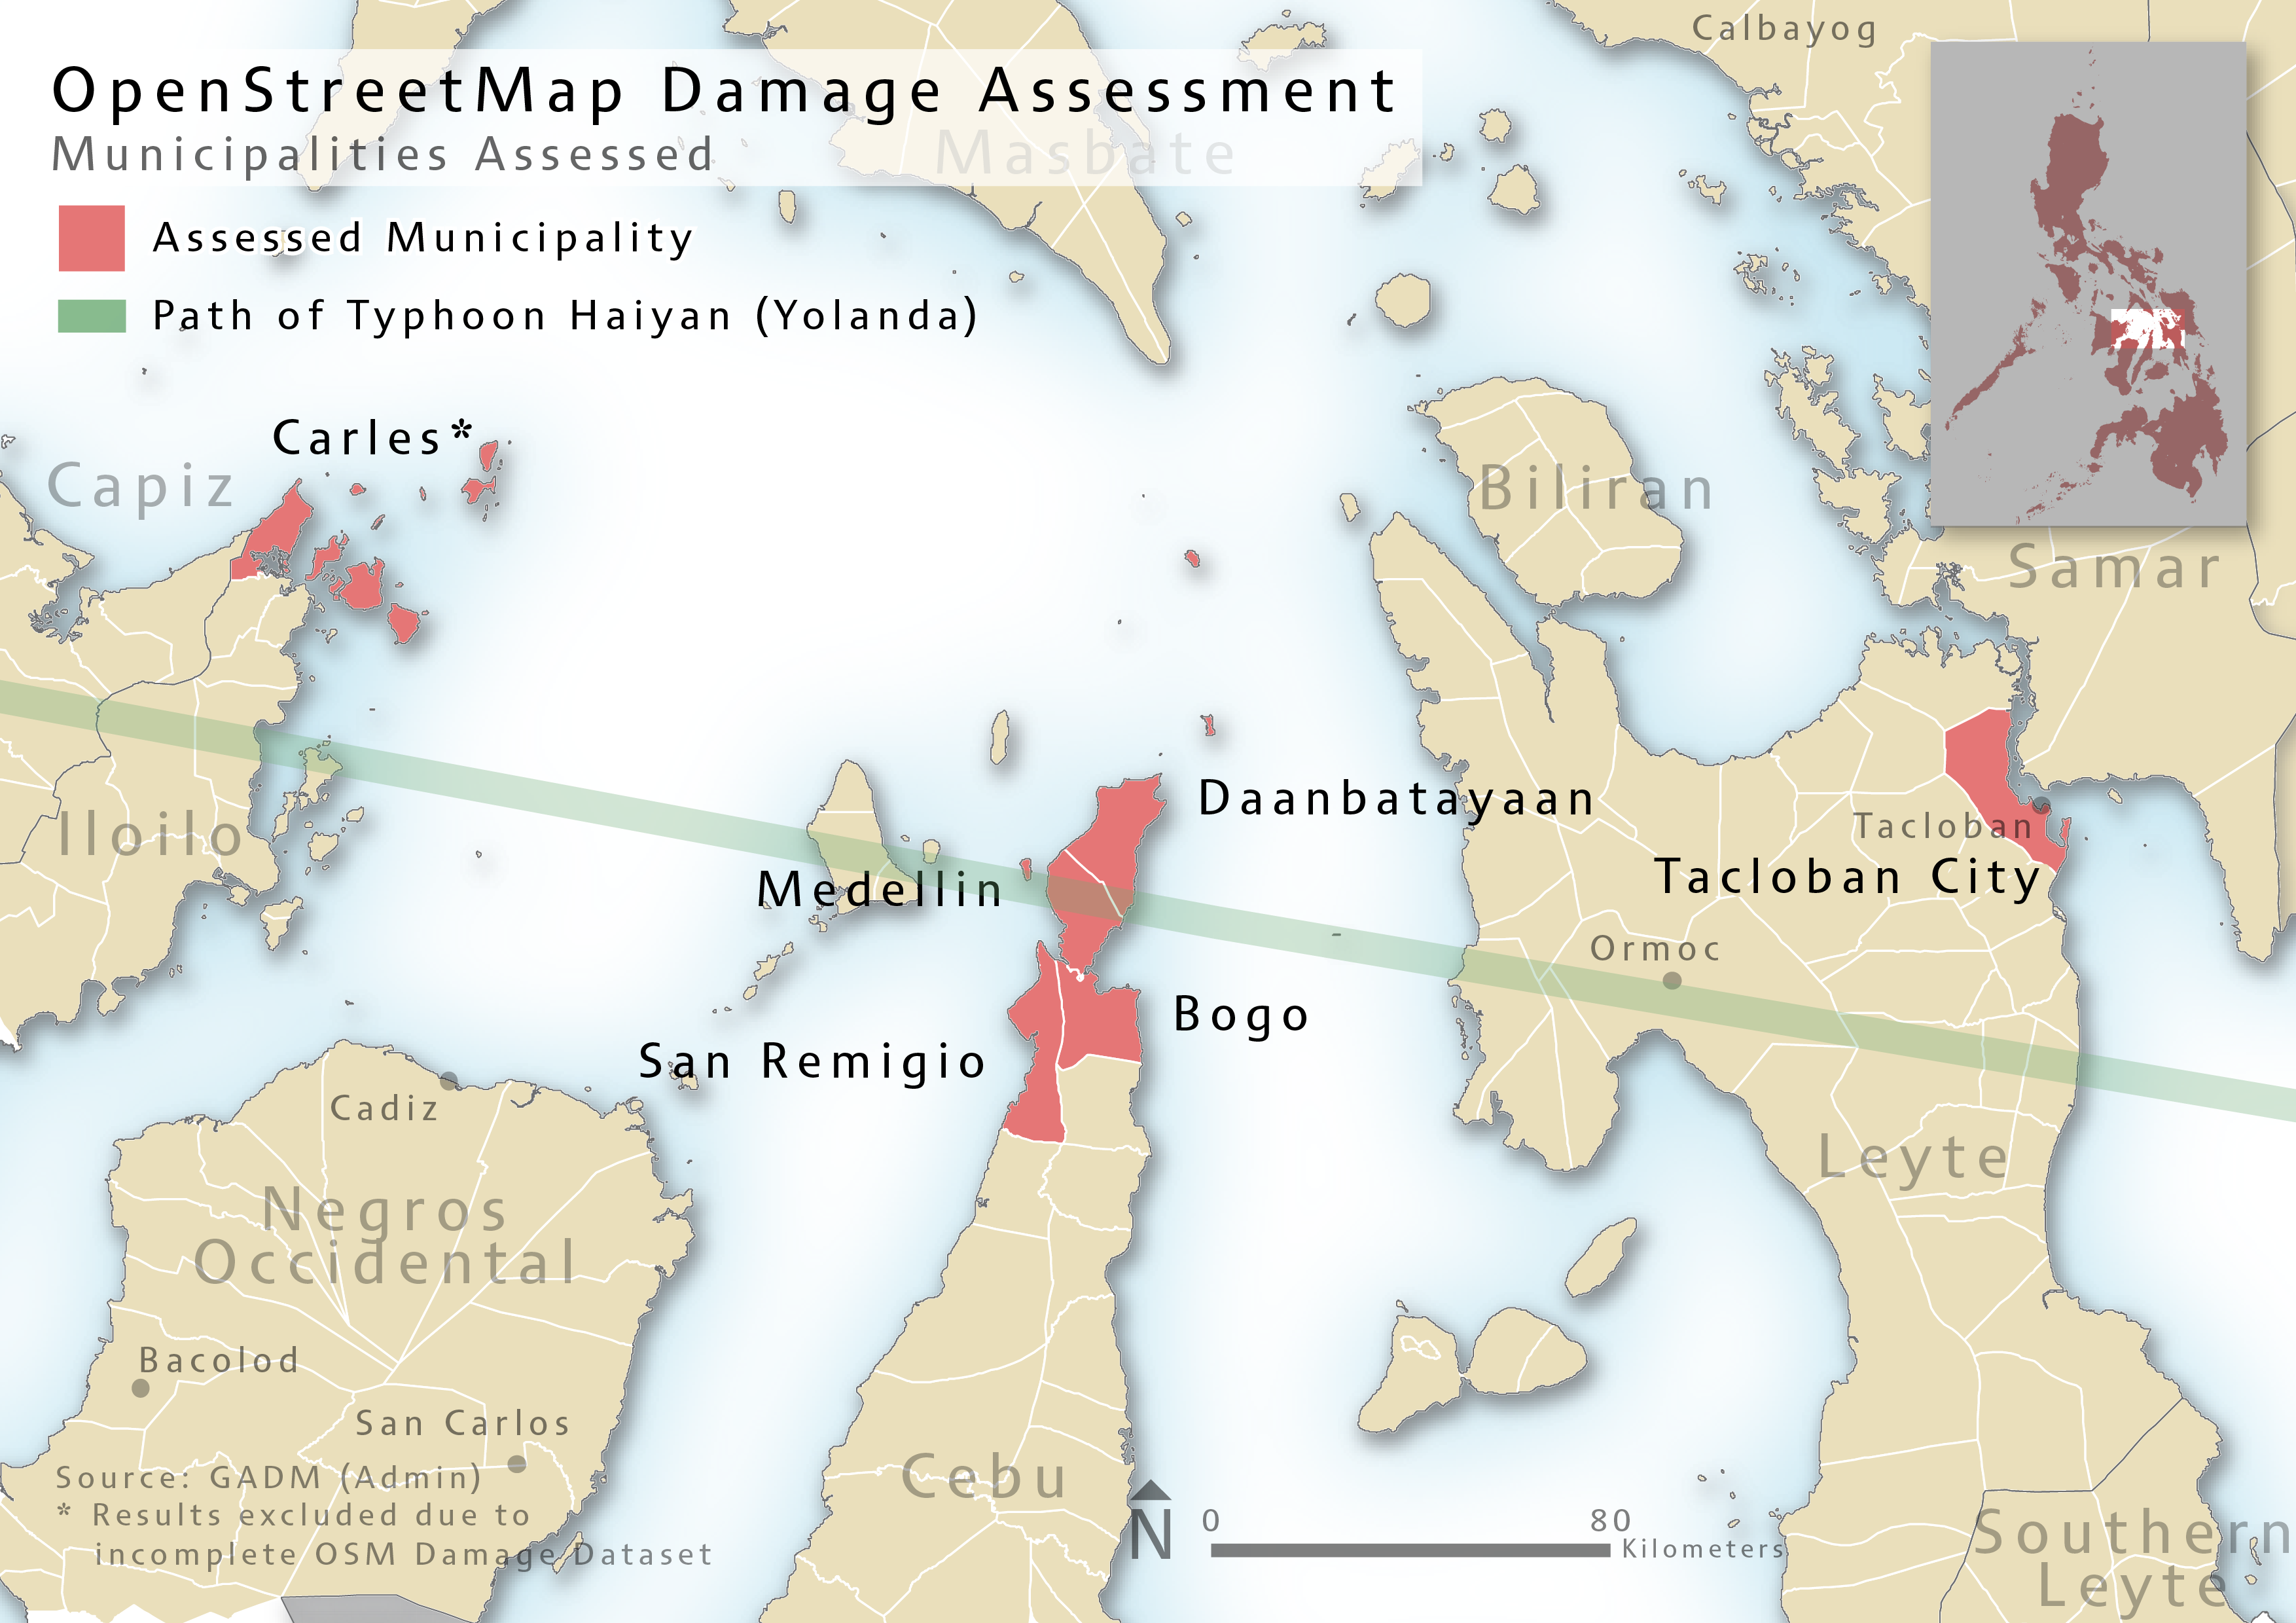 Map 2: This map shows the municipalities that were assessed forming the basis for this report.
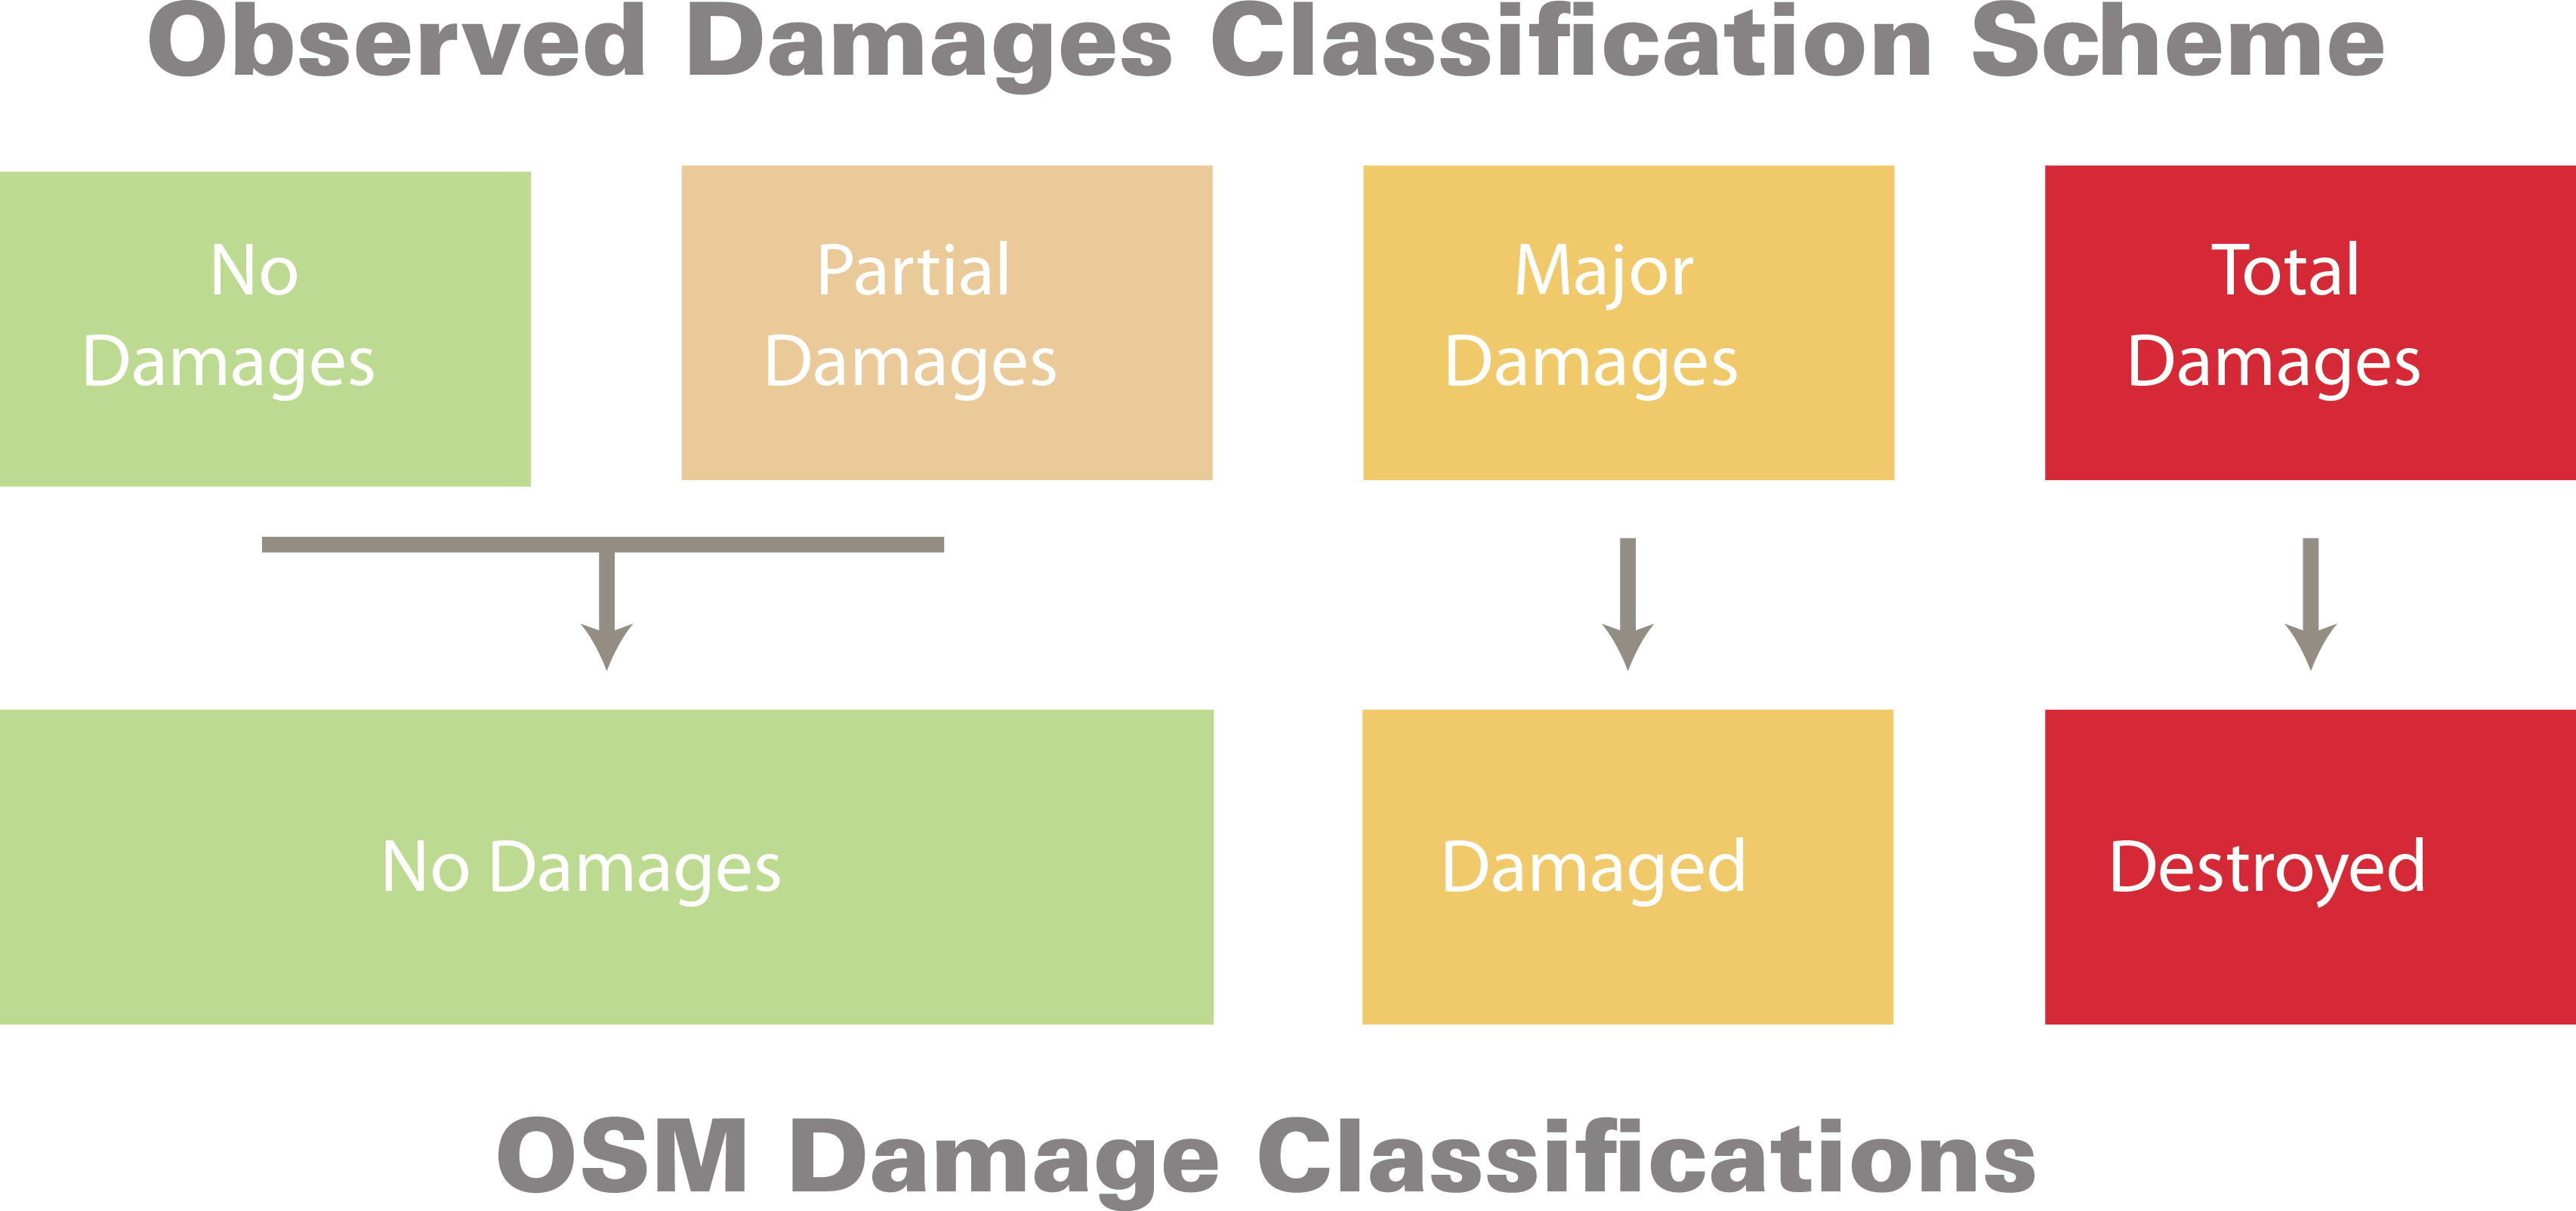
Enumerators classified building damages using the following four criteria:
- No damage
- Partially damaged (repairable damage to windows, foundations, ceilings inside buildings)
- Major damage (repairable damage to roofs rendering segments of the building inhabitable)
- Totally damaged or destroyed
Enumerators used a guidance sheet which detailed the exact criteria for each classification type to ensure consistency.
The enumerators’ categories compared with a three-category damage classification system used for OSM:
- Undamaged
- Tags: “building=yes”
- Damaged (equivalent to major damage above)
- Tags: “building=yes” and “damage=major” OR “building=damaged”
- Destroyed or collapsed (equivalent to totally damaged or destroyed above)
- Tags: “building=yes” and “damage=destroyed” OR “building=destroyed” OR “building=collapsed”
The OSM community adopted this three category classification scheme because minor damages and levels of damage as a whole could not be perceived using existing satellite imagery.
A full account of the methodology employed can be found in Annex I of this report. The damage classification criteria and guidance provided to enumerators can be found in Annex II.
Findings
The results of the assessment were encouraging but also highlighted some critical limitations of the OSM process. OSM contributors did a reasonably good job of identifying affected buildings but overestimated the number of buildings completely destroyed by the typhoon and underestimated the number of buildings that were majorly damaged.
Map 3: This map shows the changes that contributors made to OSM after the typhoon.Contributors were unable to view “partial” damages to the sides or insides of buildings due to the inherent limitations of overhead satellite imagery. Therefore, this report compares the number of undamaged buildings recorded in OSM with the undamaged or partially damaged buildings observed during enumeration. On the whole, contributors underreported the number of undamaged or partially damaged buildings by a small but meaningful margin.
These results reflect three key factors:
- The resolution of existing satellite imagery sources is too low to reliably differentiate between destroyed and merely damaged buildings.
- Buildings with major damage in particular may be mistaken for destroyed; habitable buildings with heavily damaged roofs can appear destroyed at a 1 square meter pixel resolution.
- The assessment on the ground began 20 days after the typhoon, meaning that a number of initially damaged buildings, remotely assessed by the OSM contributors within 7-10 days of the disaster, were repaired or reconstructed by the time they were observed on the ground.
The summary numbers below show these trends:
| Damage Classification | OSM (%) | Observed (%) | Difference | Percent under/over-represented in OSM |
|---|---|---|---|---|
| Destroyed | 32.76 | 14 | 18.76 | Overrepresented 134% |
| Major Damage | 29.19 | 39.24 | -10.05 | Underrepresented 25% |
| No / Partial Damage | 38.05 | 46.77 | -8.72 | Underrepresented 18% |
Additional key statistics:
- Destroyed buildings were over-reported by 134% and majorly damaged buildings were under-reported by 25%. Partially damaged and undamaged buildings were under-reported by 18%.
- Of buildings tagged as “collapsed” or “destroyed” through OSM, only 16% were actually destroyed: 43% were majorly damaged, 25% were partially damaged and 15% were undamaged.
- Buildings tagged as “undamaged” were actually majorly damaged or destroyed 50% of the time.
- Of buildings tagged as “damaged,” 8% were actually destroyed, 21% were undamaged and 71% were actually damaged (majorly or partially).
These statistics hint at subtler factors at play which will be fleshed out in the forthcoming final report.
However, further investigation in this report of the third statistic highlighted above is warranted because it suggests problems with the data informing the high level analysis. By randomly selecting buildings marked in OSM as undamaged and flagged by enumerators as heavily damaged or destroyed and assessing them with the imagery provided to OSM contributors, the assessment found the following:
- In most cases the limitation was the imagery that seemed to show undamaged buildings when in reality they had sustained damage.
- In a few cases, the imagery was unclear due to low resolution, so OSM contributors appeared to have left the buildings’ tags untouched as per the instructions provided for unclear buildings. Future guidance instructing contributors to mark “damage=unclear” in such situations could avoid this problem.
- In a final two cases two clearly damaged buildings had been incorrectly labeled as “building=yes” (or “undamaged”). They also lacked the review tags indicating whether a building was assessed for damages or not. This suggests that the buildings may have been accidentally overlooked during OSM editing. Unfortunately contributors were inconsistent in their use of the review tags, making it impossible to analyse the impact of this factor further.
Recommendations
 |
Ground Assessment |  |
Remote Assessment |
|---|---|---|---|
| 1. Data Preparedness for Disaster Preparedness | 1. Improved Tagging Schemas | ||
| 2. Better tools for data collection | 2. Better Crowd Coordination | ||
| 3. Guidance Materials | |||
| 4. Comprehensive Validation Process | |||
| 5. Emphasis on Comparison | |||
| 6. Timely Imagery Provision | |||
| 7. Targeted Imagery Acquisition |
Ground Assessment Recommendations
This assessment found that while OSM works well as a rough damage assessment platform for humanitarian responders during a disaster response, flaws still exist. Below are some recommendations to improve its utility:
1. Data Preparedness for Disaster Preparedness
Investing in the creation of detailed building data layers within OSM prior to disasters will improve OSM contributors’ ability to spot missing or damaged buildings and build an accurate snapshot of damages.
The marginally constructed shelters commonly inhabited by poorer Filipinos were often too small to be observable from satellite imagery and therefore went unrecorded. On other occasions, buildings were reduced to scattered rubble or destroyed down to their foundations, leaving nothing to observe from above. In total, 374 (19.8%) of the structures covered by this assessment were not in OSM and do not feature in the above analysis.
To rectify this situation, investment should be made in creating stronger pre-disaster base layers in OSM for priority disaster-prone areas. These investments should fund initial remote mapping paired with detailed building surveys on the ground by governments, NGOs, universities or local Red Cross or Red Crescent national societies. This pre-disaster base data would ensure comprehensive and successful post-disaster remote damage assessments. Forward looking institutions like the World Bank and the Australian-Indonesian Facility for Disaster Reduction (AIFDR) have funded promising projects along these lines in Kathmandu and Jakarta; additional work should be considered by funding agencies.
2. Better tools for data collection
Linking other assessments and surveys to OSM is, at present, an inconsistent process. Manual verification based on orienting using paper maps and recording 10 digit ID numbers by hand unavoidably introduces errors. Several hundred recorded households could not be linked with OSM due to incorrectly recorded OSM ID numbers. This hindered the assessment and caused much wasted effort. Moreover, concerns about the reliability of the process for linking collected data to OSM and the considerable spatial navigation difficulties reported by some enumerators effectively prevented the assessment from linking data from the REACH comprehensive shelter assessment to OSM buildings.
We strongly recommend building a mobile data survey tool for field assessment teams, built on open source technology, to link damage assessment data (and other humanitarian data) to OSM. This will improve the speed and accuracy of the work described above and set the stage for any number of humanitarian assessments to directly leverage OSM data.
Remote Assessment Recommendations
This assessment found existing tools for conducting remote damage assessments with OSM fundamentally robust but hampered by underdeveloped support and business processes. The following improvements would enhance the reliability of crowdsourced damage assessments:
1. Improved Tagging Schemas
The ad-hoc tagging schema used for this operation created a number of problems during the analysis phase. To avoid this challenge, the OSM community needs to standardize a set of damage tags that can be used and/or modified for future disasters. Specifically, a tagging schema that separates the type of a feature (e.g. a building) and its damages will improve the ease of analysis. These should feature a tag to indicate unclear or inconclusive imagery for damages. Finally, a consistent tag indicating that a feature has been reviewed in the context of a specific disaster will help.
2. Better Crowd Coordination
This assessment demonstrated the continued responsiveness and diligence of the crowd when well directed. For example, the entire municipality of Carles was mapped and mostly within 48 hours after the request of the American Red Cross. Impressively, this occurred three weeks after Typhoon Haiyan made landfall when media attention no longer drove OSM contributors towards the Humanitarian OpenStreetMap listserv and web platform.
Humanitarian agencies that build technical expertise and cultivate relationships with OSM should be able to direct remote OSM contributors towards priority mapping tasks not just during the initial response period but well into the recovery phase of an operation. Quality communications and transparency about goals, products, and successes are the key inputs to ensure quality outputs.
Additionally, humanitarian agencies should work to link the OSM community with the humanitarian coordination system during a crisis response in order to ensure that priority areas are assessed and information is shared with agencies even without a direct relationship with the OSM community.
3. Guidance Materials
Satellite imagery assessments lend themselves to well-documented processes and guidelines. Creating generic and disaster-specific damage assessment guidance materials for remote mappers would improve the accuracy of results and reduce the number of potentially inaccurate judgment calls contributors are asked to make. The OSM community should strive to build documents of lessons learned and best practices for disaster assessments in order to mitigate the impact of OSM community members leaving the community and depleting the institutional memory of the platform.
Tailored materials featuring disaster-specific imagery could help to better identify damage patterns common to local construction types and improve the accuracy of the data created for a given disaster.
Ideally OSM contributors would be required to watch a short YouTube video or skim a 5-10 page visual guide to damage tagging before beginning a task. This contrasts with the open-ended process that currently reigns that has led to a lack of consistency in methodology and, therefore, inconsistencies in quality.
4. Comprehensive Validation Processes
Tighter, better-understood validation procedures within the humanitarian OpenStreetMap community would catch many of the errors highlighted in the findings section. Many members of this community possess considerable professional or amateur imagery analysis experience. Others are interested in acquiring these skills. Efforts should be made to create and document a more structured validation workflow that clearly identifies roles and expectations for key individuals. This could be linked with the guidance materials recommended above for a more cohesive overall package. A quality scoring process would also benefit the community in order to target those members that consistently produce higher quality work and to encourage those with lower scores to attend a training before engaging in additional work.
5. Emphasis on Comparison
Remote damage assessors’ workflows should compare pre and post-disaster imagery more extensively to better identify missing or damaged buildings. Moving beyond sole reliance on post-disaster imagery will improve identification of missing or completely destroyed features, as described below.
Pre-disaster imagery, beyond available Bing imagery, should be used wherever possible. This step should be documented in a given OSM Tasking Manager task workflow and a link to the appropriate imagery provided.
6. Timely Imagery Provision
The rate of recovery within a disaster zone can easily outpace the rate at which satellite imagery is acquired, analysed, and shared; where imagery is slow, response activities are not. These delays in data acquisition ultimately slow the adoption and use of created data. The OSM community’s reliance on dated imagery reduces the accuracy of damage assessments and applicability of the data. Imagery not released quickly can become obsolete or inaccurate within a matter of days, leading to equally inaccurate damage assessments and less timely information. This is compounded by the existing slow distribution of imagery and imagery derived products to the field caused by bandwidth limits.
To overcome these limitations, imagery providers should streamline imagery releases to make imagery openly released within 24-48 hours of a disaster instead of weeks afterwards.
7. Targeted Imagery Acquisition
Satellite imagery coverage areas within the Philippines were driven by popular media accounts rather than actual needs or requests from the ground. In the Philippines many affected areas went uncovered while Tacloban City was targeted dozens of times.
Humanitarian response agencies should build strong relationships and information sharing processes with satellite imagery providers and humanitarian coordination structures to better target affected areas.
Conclusions
At present, damage assessment data in OpenStreetMap falls short of the reliability rates needed to make it a credible, useful source for damage analysis. Damaged and undamaged buildings are too often confused for one another and overall reliability rates are slightly off of where they need to be credible as even a rough, approximate initial snapshot. On the ground, existing tools for linking OSM to existing shelter surveys are too error-prone and manual to support expansive programming centred around linking shelter assessments with OSM data.
However, these shortcomings have little to do with OpenStreetMap itself and everything to do with the shortcomings of the imagery inputs, technology and business processes supporting this work. As satellites improve and unmanned aerial vehicles proliferate, imagery resolution will increase to a point where remote volunteers can assess building damages for even the smallest of dwellings with confidence. In the meantime, refinements to the mechanisms used to deliver imagery, improvements to the guidance and training of OSM contributors and standardized validation review procedures for contributor data would greatly boost the accuracy of this data. Most importantly, stronger efforts to create pre-disaster base data layers will enhance the speed and reliability of remote damage assessments whilst yielding immediately useful data.
Forward-thinking aid agencies and funders should invest now in the disaster preparedness approaches and technology needed to make OSM operationally useful for disaster preparedness and response. Communities, cities, provinces and countries hosting these activities and agencies adopting these technologies will benefit when disaster strikes and they can use OpenStreetMap for damage analysis and post-disaster planning. OpenStreetMap is strong because it’s an ecosystem; a collection of tools and approaches designed to support a central database and map. That makes it powerful, resilient and adaptable, but also difficult to improve or utilize in a piecemeal fashion. For that reason, policymakers that take engagement with OpenStreetMap seriously enough to make investments for the long-term will reap much greater operational rewards. Thoughtful, sizeable and sustained investments will make the difference between OpenStreetMap’s currently limited utility to disaster operations and a more robust geographic open data platform that can be the foundation for understanding and implementing disaster response activities.
Other Resources
- OpenStreetMap is a project to create and distribute free geographic data for the world. It is being built by volunteer contributors.
- The Humanitarian OpenStreetMap Team (HOT) utilizes OSM to assist disaster response and development needs. Find out more about their activities in general at http://hot.openstreetmap.org and Typhoon Haiyan
- Learn to contribute to OpenStreetMap at http://learnosm.org and http://mapgive.state.gov
- The MapAction Field Guide to Humanitarian Mapping is a detailed manual available for download at http://www.mapaction.org/resources.html